Tata Data Visualization Internship
Power BI dashboards analyzing business scenarios, seasonal revenue, and global product demand.
Project Overview
This project features tasks completed as part of the Tata Data Visualization Forage Virtual Internship. The core focus was to analyze business scenarios, select optimal visualization methods, and communicate data-driven insights effectively to executives.
Data Visualization Workflow
The internship involved a structured approach to solving business intelligence problems:
Scenario
Business Needs
Visuals
Chart Selection
Dashboard
Design UI
Insights
Executive Comm.
Key Insights Delivered
Created specialized views to answer specific strategic questions:
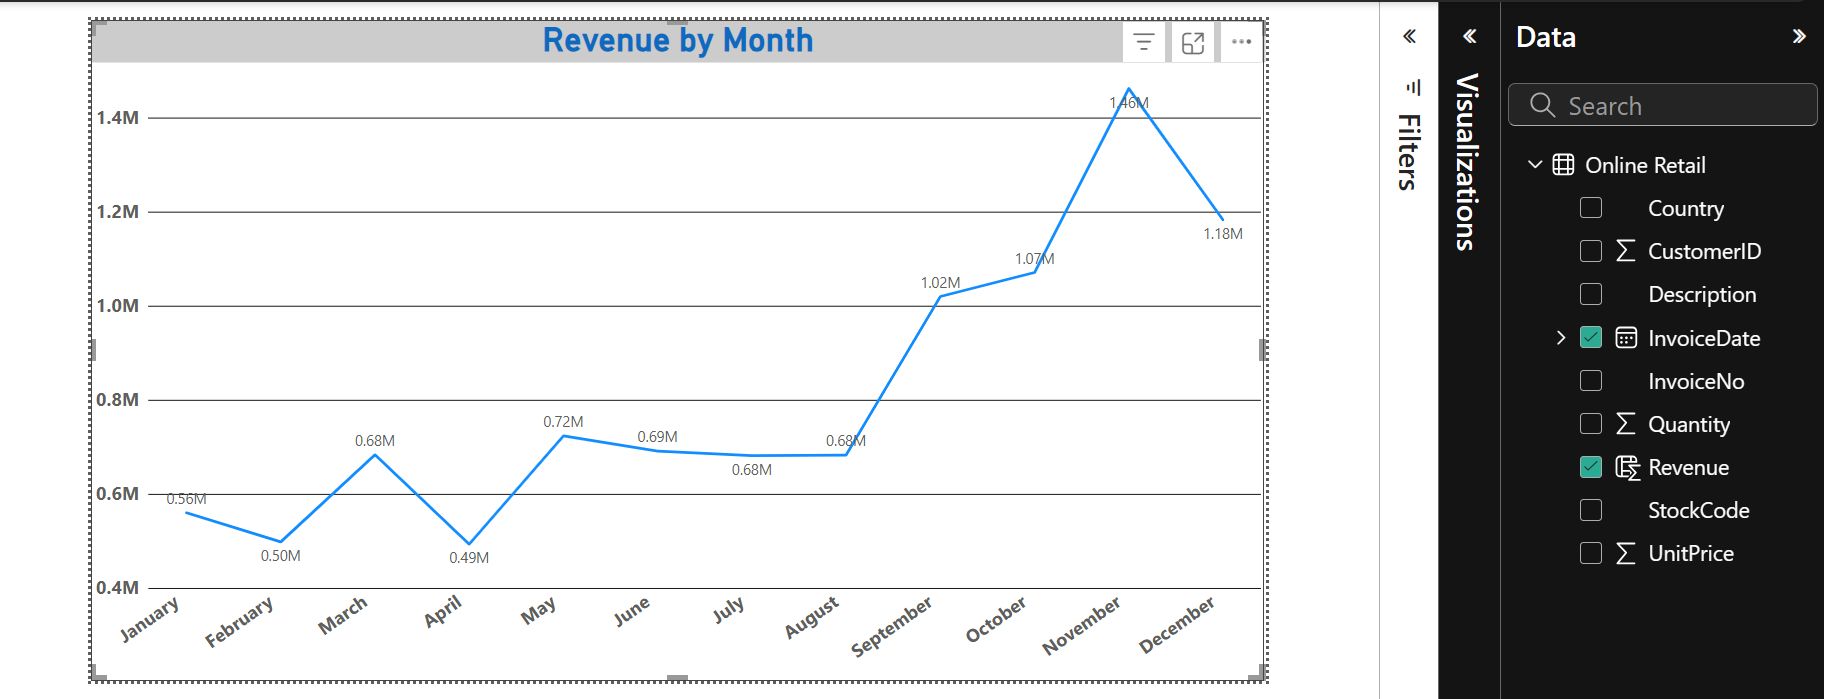
Revenue Trends (2011): Built time-series analysis to track monthly revenue, helping forecast sales.
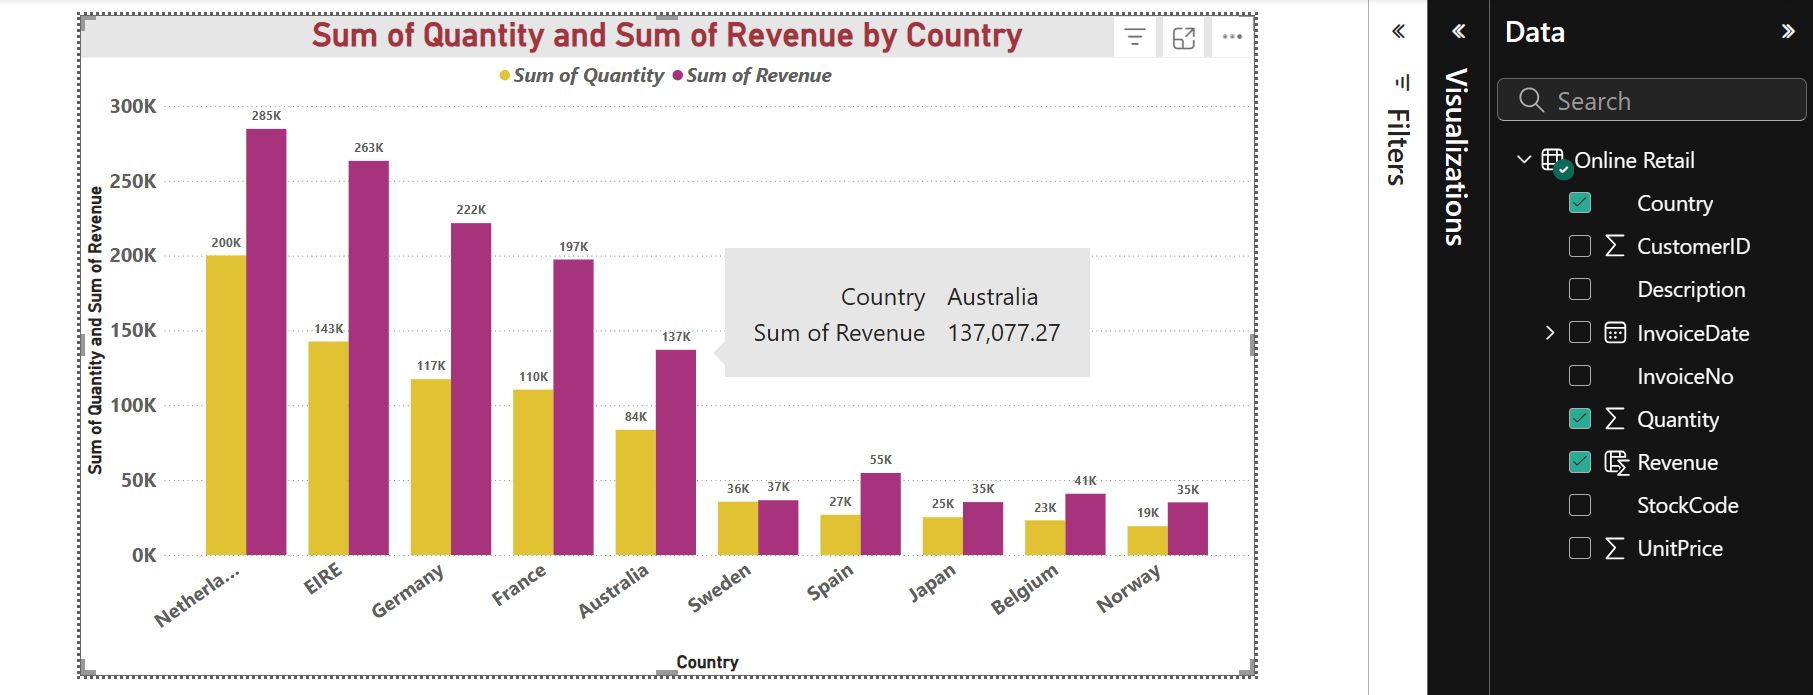
Top Revenue-Generating Countries: Bar charts highlighting highest contributors (excluding the UK).
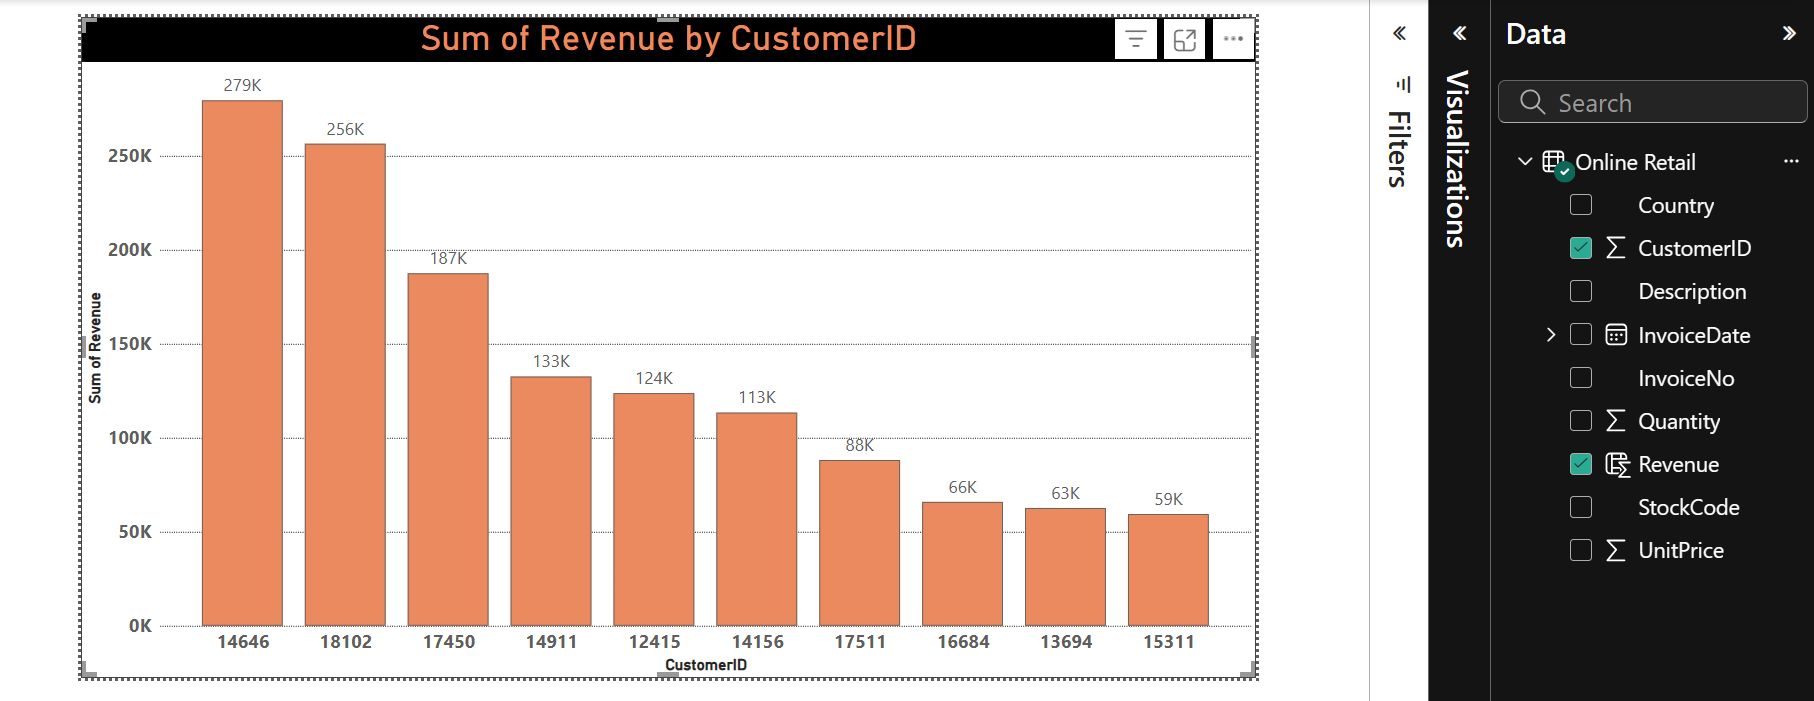
Top Customers by Revenue: Descending revenue charts to help CMOs identify and retain high-value clients.
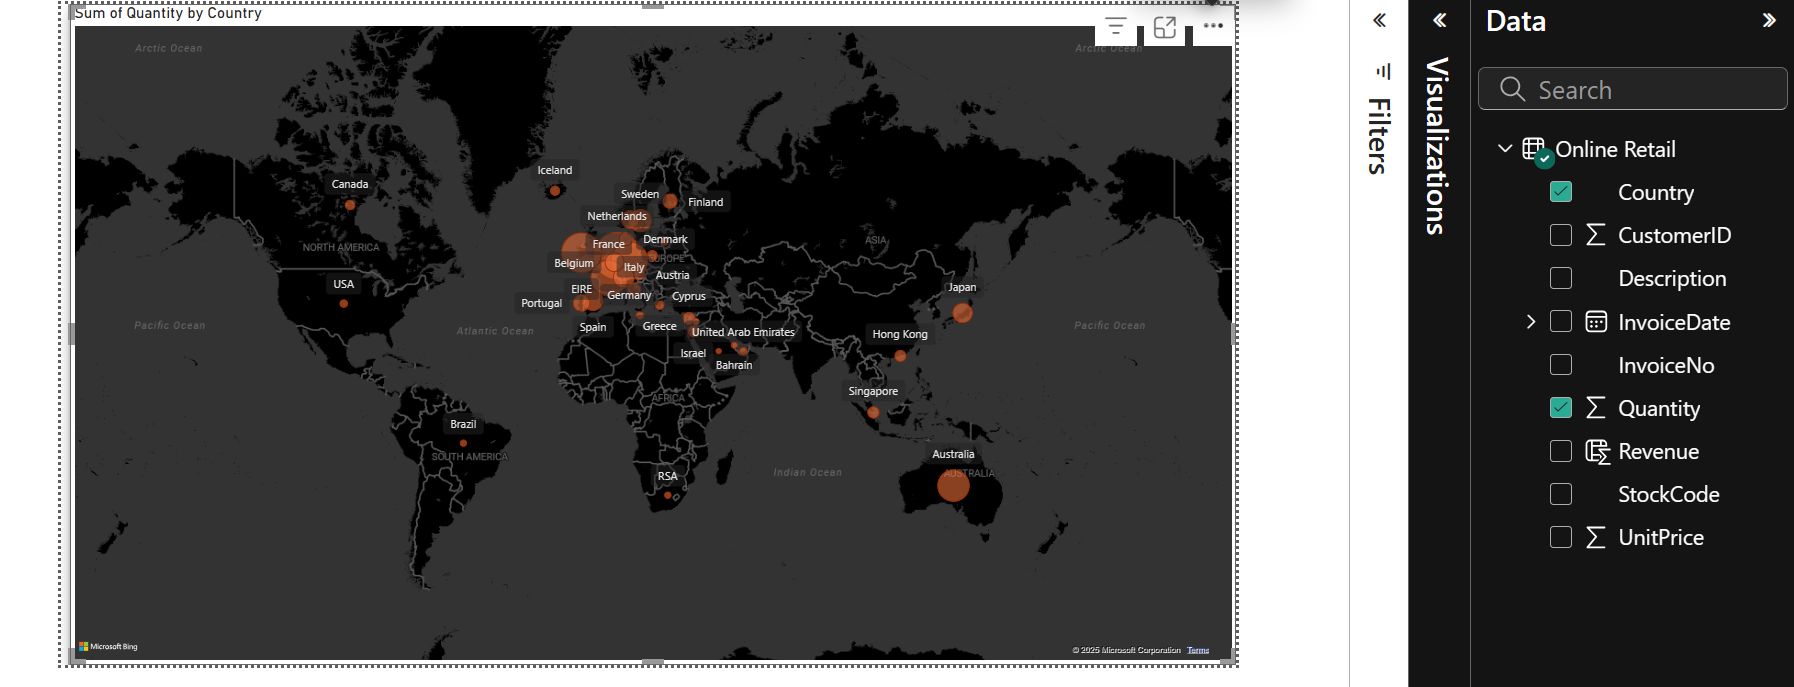
Global Product Demand: Comprehensive analysis of high-demand regions for global expansion planning.
Tools Utilized
Leveraged industry-standard BI tools for data manipulation and visualization:
Power BI (Visualizations, Formatting, Dashboards)
Excel (Raw Data Management)
Business Storytelling & Executive Communication
Project Gallery
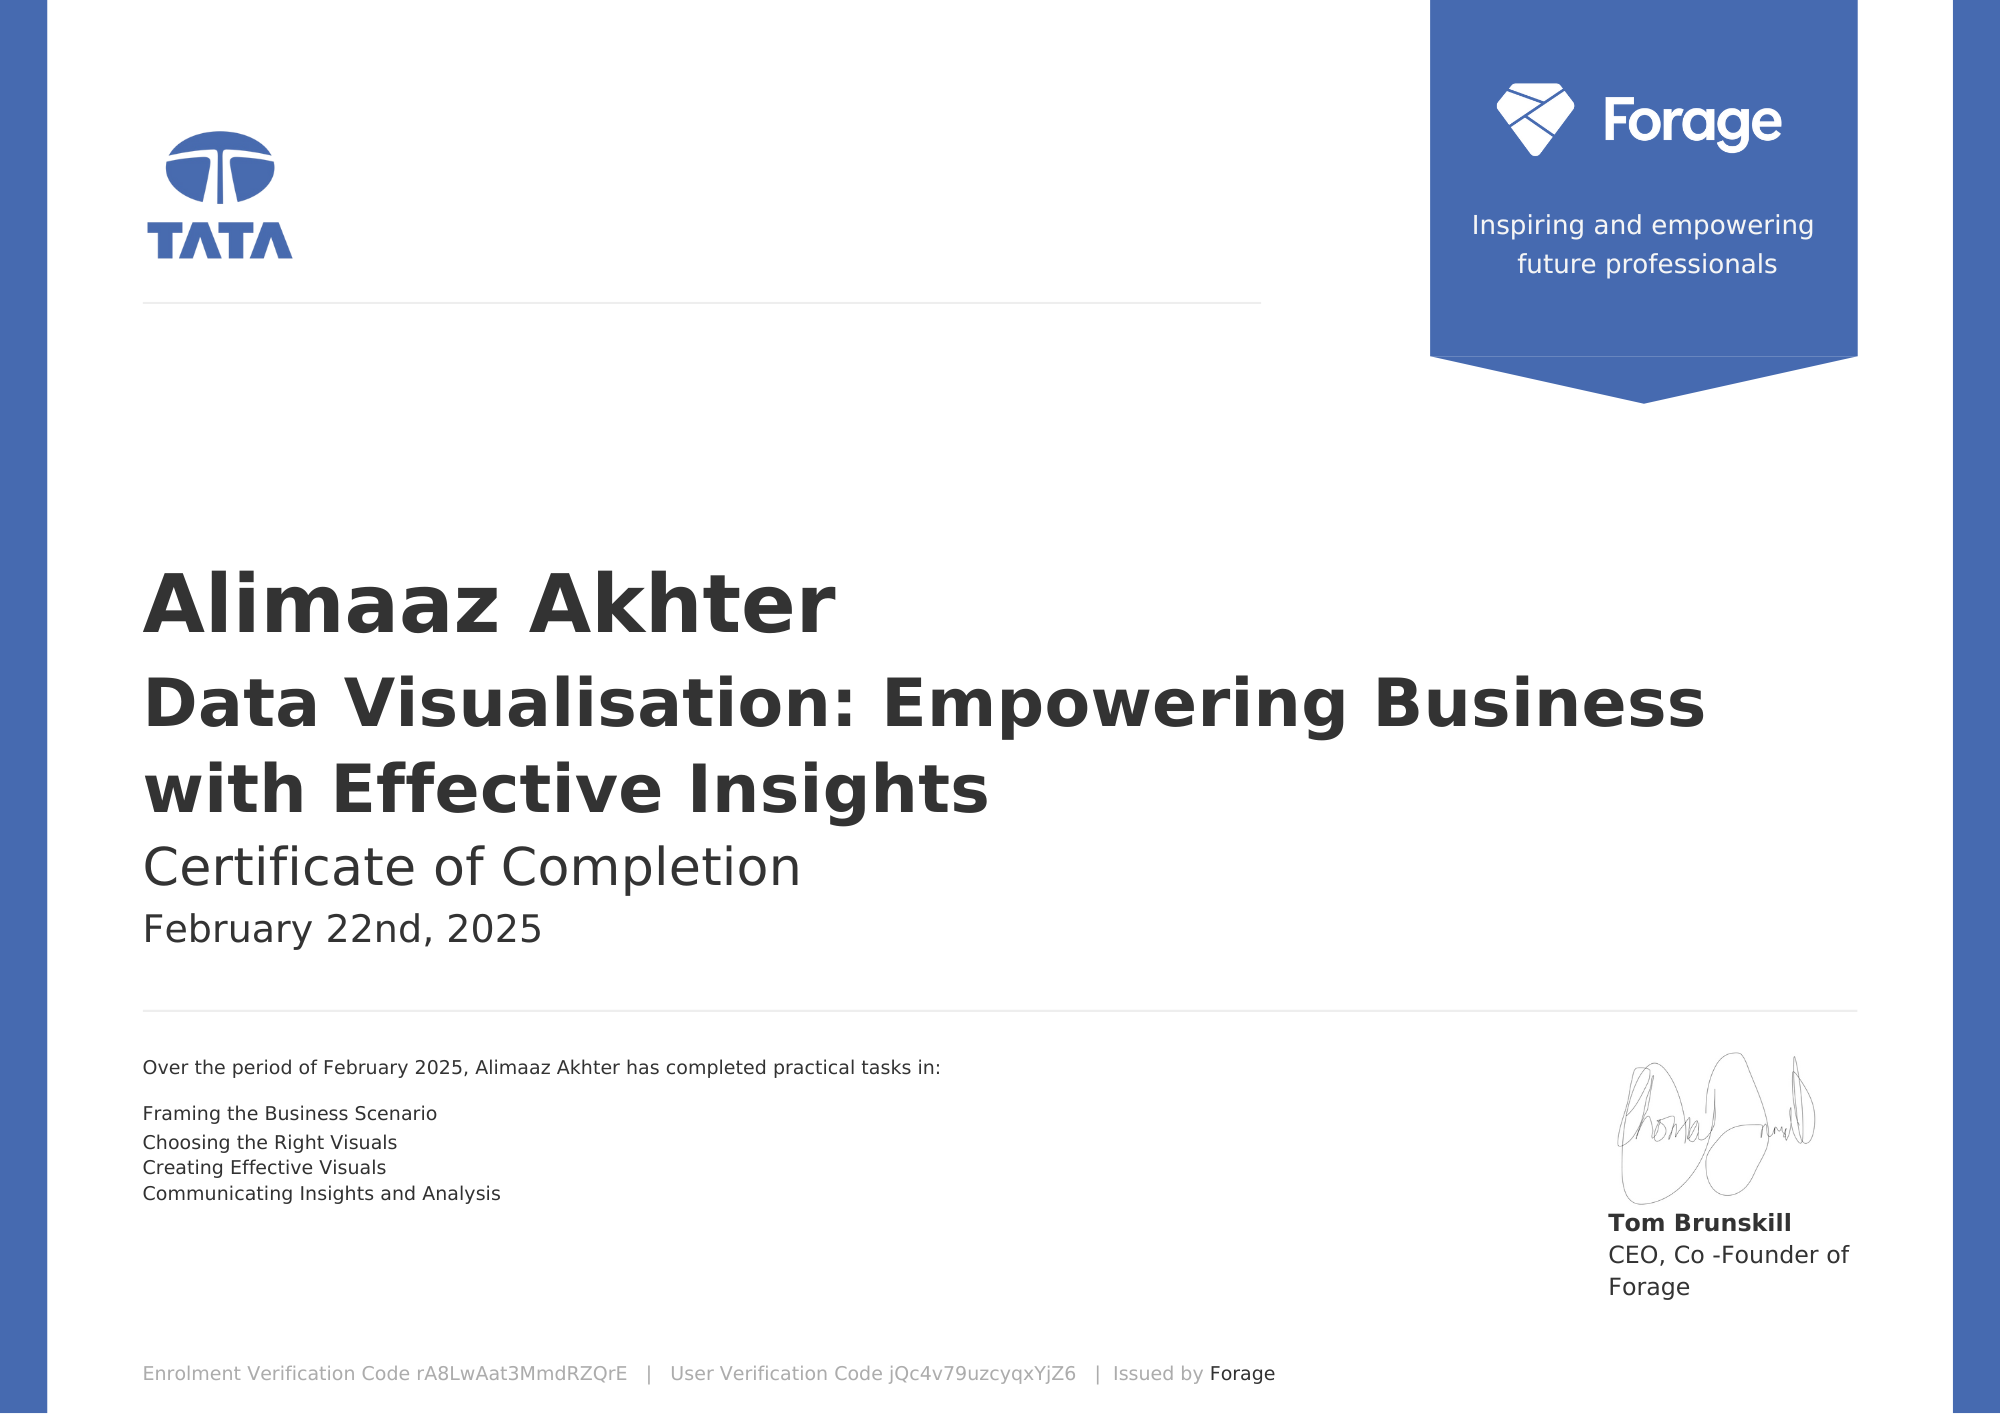
Certificate of Completion
Project Note
Download the complete .pbix files and raw dataset from the GitHub repository to view the interactive dashboards locally.